


Quality Receiving Production: Will Fuller
An In-Depth study into Will Fuller's 2020 season

Not all wide receiver production is created equally.
When examining the effectiveness of wide receiver play at the NFL level, it can be easy to rely on raw statistics such as receptions, yards and touchdowns. However, those don’t tell the entire story.
There are various reasons that those statistics aren’t the end-all, be-all. Wide receivers play with different quarterbacks, face different defensive schemes and are slotted into different roles. Wide receivers can be effective route runners but suffer from poor quarterback play, or draw extra attention from coverage because of a lack of talent surrounding them.
In order to look deeper in a wide receiver’s effectiveness as a route runner, I’ve quantified numerous significant measures to better understand the effectiveness of NFL wide receivers. These will help show individual wide receiver’s strengths and weaknesses.
With Will Fuller’s season having come to an abrupt end due a suspension, I’ve charted his full season using the All-22 coaches tape.
Route Tree
Fuller is known as one of the premiere vertical threats in the NFL, and his route tree is a shining example of that. Over 40% of his receiving yards and 6 of his 8 receiving touchdowns came on straight vertical routes such as a Go, Fade, or Seam.
Fuller was asked to be a more complete wide receiver this season, in his first year as the Texans #1 target. Fuller did an excellent job of rounding out his skill-set, showing success on multiple branches beyond the deep routes.

Route Success
Route Success is defined by how well the wide receiver ran a given route, regardless if a reception was made because that is reliant on a properly thrown pass. The receiver would have to create a clear passing window, on time, where a throw could or should have been made.
Will Fuller Route Success, by Route:
Screen: 100%
Hitch: 100%
Speed-Out/Flat: 100%
Slant: 81.25%
Crosser: 83.3%
Curl: 100%
Comeback: 50.0%
Dig: 42.9%
Out: 80.0%
Corner: 75.0%
Post: 66.6%
Go: 56.25%
High Quality Route vs. High Quality Opponent
For some top NFL wide receivers, they continually draw the best cornerbacks in the NFL in coverage. This not only helps the offense by allowing the rest of the pass catchers to operate against lesser defensive backs, but is extra impressive when the wide receiver is able to produce against the best defensive backs that the league has to offer.
I wanted to be able to quantify how well each wide receiver performed against those top cornerbacks. High Quality Route vs. High Quality Opponent only takes the reps that the wide receiver ran a challenging route against difficult coverage from the top-tier of cornerbacks. This means that routes such as a wide receiver screen, or a hitch route against off coverage, haven’t been counted.
The top cornerbacks in the NFL can be subjective, so I only took those players who have recently been named to the Pro Bowl or All-Pro team.
Will Fuller High Quality Route vs. High Quality Opponent:
6/10 (60.0%)
64 receiving yards
Success vs. Coverage
Similar to the information discussed when looking into the route tree, some wide receivers find better success against man coverage compared to zone coverage. Splitting their route success and production dependent on coverage can help us understand exactly how defenses will choose to play against them in the future.
Will Fuller vs. Man Coverage:
Route Success: 69.6%
22/330 (66.6%)
432 receiving yards
4 touchdowns
Will Fuller vs. Zone Coverage:
Route Success: 83.3%
31/42 (73.8%)
447 receiving yards
4 touchdowns
3 interceptions
Will Fuller vs. Press Man Coverage
Route Success: 66.6%
15/24 (62.5%)
387 receiving yards
4 touchdowns
Area of Field
There are generally differences in skill-set for wide receivers who play primarily on the boundary vs. primarily in the slot. As far as route runners go, slots are going to be asked to run routes over the middle more often than an “X” or “Z” receiver.
I’ve broken down the area of the field where each target was thrown to Will Fuller.
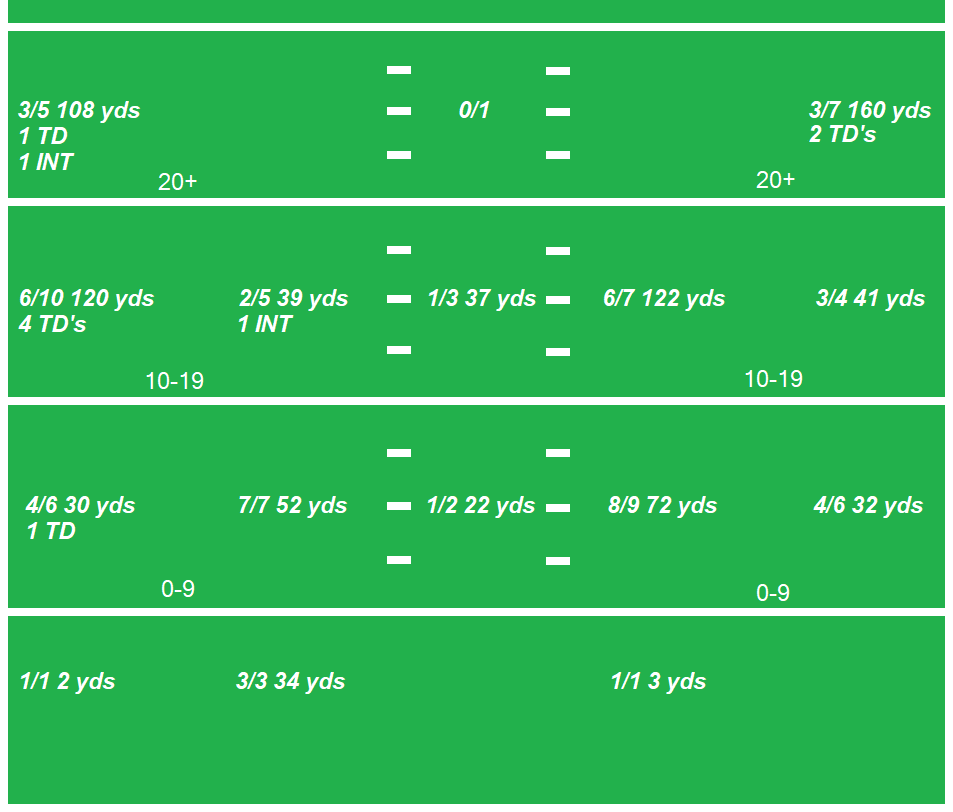
Will Fuller between the #’s and the sideline:
24/39 (61.5%)
493 receiving yards
8 touchdowns
1 interception
Will Fuller between the #’s and hash marks:
27/32 (84.4%)
322 receiving yards
1 interception
Will Fuller in-between the hash marks:
2/5 (40.0%)
59 receiving yards
Depth of Target
Wide Receivers that are vertical threats effect defenses differently than those who catch more underneath passes. Deep threats can dictate coverage more than horizontal route runners, as preventing explosive plays is always on the mind of defensive coordinators. This adds value to an offense, as multiple defensive backs could be committed to preventing the deep ball.
For that reason, a wide receiver’s success beyond 20 yards can be significant as it not only adds explosive plays, it opens up coverage for the rest of the route tree.
Will Fuller on 20+ Yard Throws:
6/13 (46.2%)
268 receiving yards
3 touchdowns
1 interceptions
Will Fuller Average Depth of Target
12.62 yards
Additional Advanced Statistics
Yards After Catch:
301 yards on 38 receptions that YAC was available (receptions that weren’t in the end-zone, required a toe-tap or dive, or where Fuller was able to make a football move before getting tackled)
7.92 YAC/reception
Broken Tackles:
4
Drops:
3
Contested:
2/5 (40.0%)
Conclusion
Be sure to subscribe to The Slant Route to continue seeing these Quality Receiving Production breakdowns. These will continue to grow with graphics, charts and spreadsheets available.